
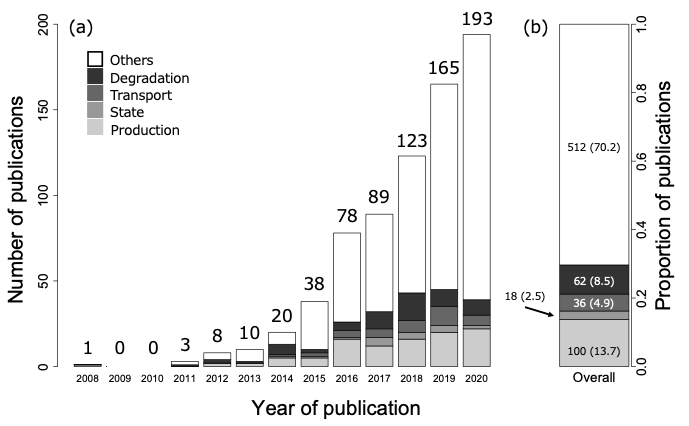
(a) Time-series changes in the number of macrobial eDNA studies. The total number of studies published in each year is shown at the top of the bar plot. (b) The total number of studies corresponding to each keyword. The percentage (%) of the total is represented by the number in brackets. [Quoting Figure 2 from the original paper]